NielsenIQ
Several independent analytics applications, each built for a different kind of customer, consolidated into one product that every customer could use. I led the research, interviewing more than fifty people and using an object-based model to find the shape the new product should take.
- 2022
- Lead UX researcher
- ~1 year
- Web app
The brief
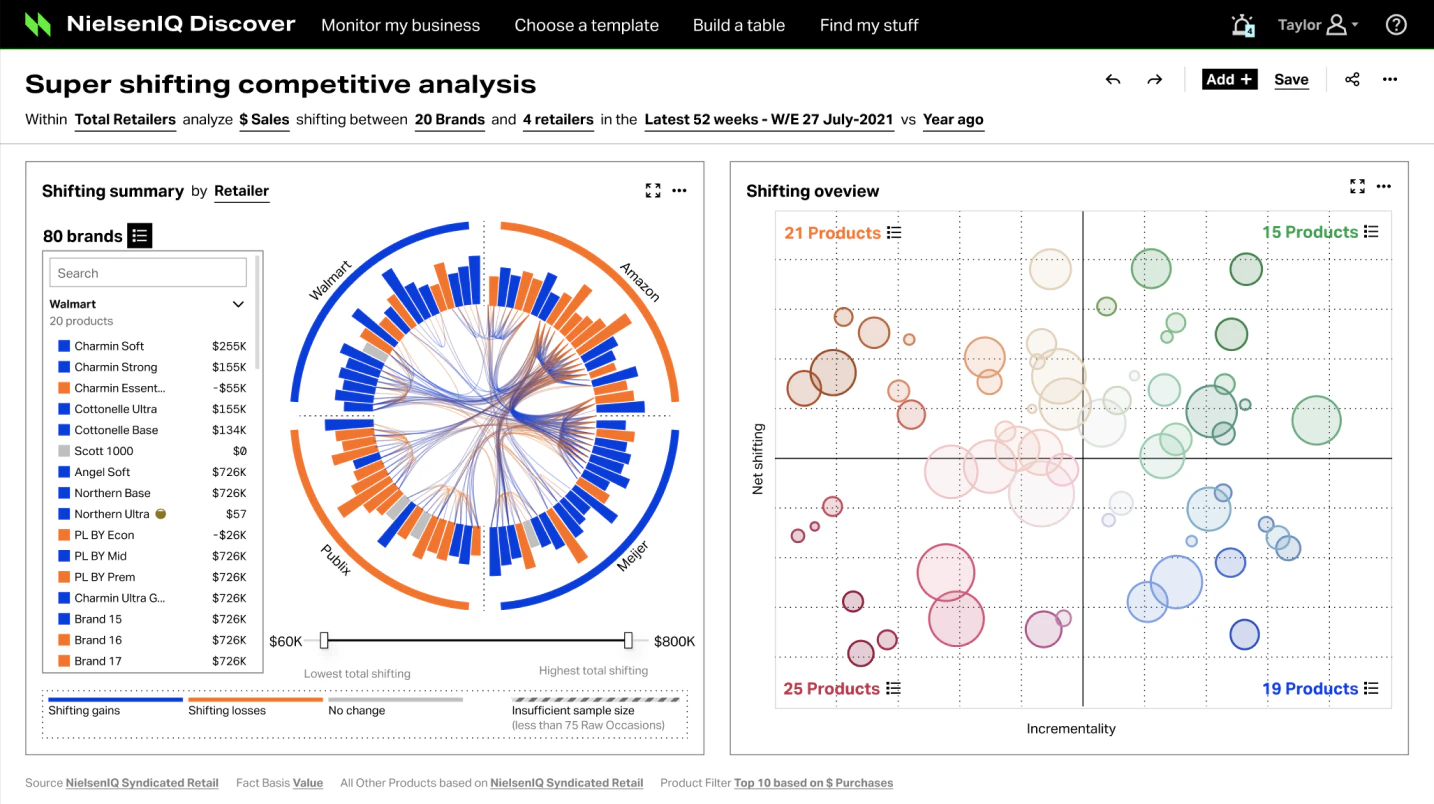
NielsenIQ is a global information services company, with a view of consumers and markets that covers about 90% of the world's population. Its customers were spread across separate applications, each built for one audience (retailers, manufacturers, financial analysts) and each pulling from its own data source, whether retail data, RMS data, or others.
The goal was one application for every customer. Two things made that hard. Because each app had grown around its own use cases, the patterns and components were inconsistent from one to the next. And the database structure underneath could not change: an overhaul of the system architecture was off the table, so the design had to work with it.
Research
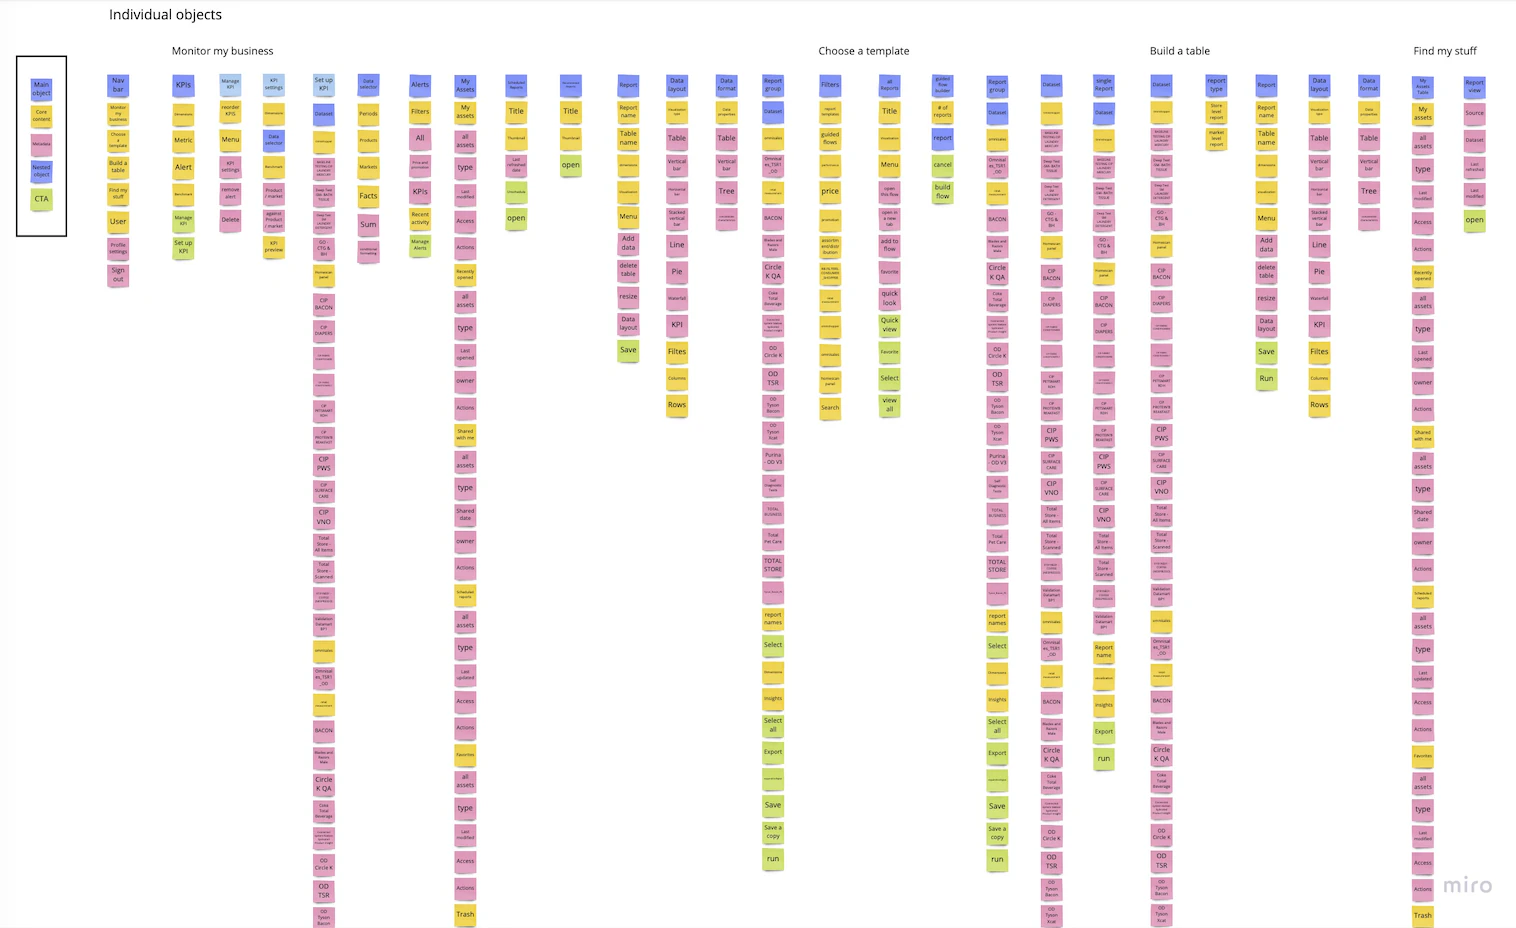
I interviewed more than fifty people across every side of the business: project stakeholders, retail customers, manufacturing customers, analyst customers, and subject matter experts. From there I mapped the recurring themes into categories and defined the objects that kept coming up in conversation.
Objects, not features
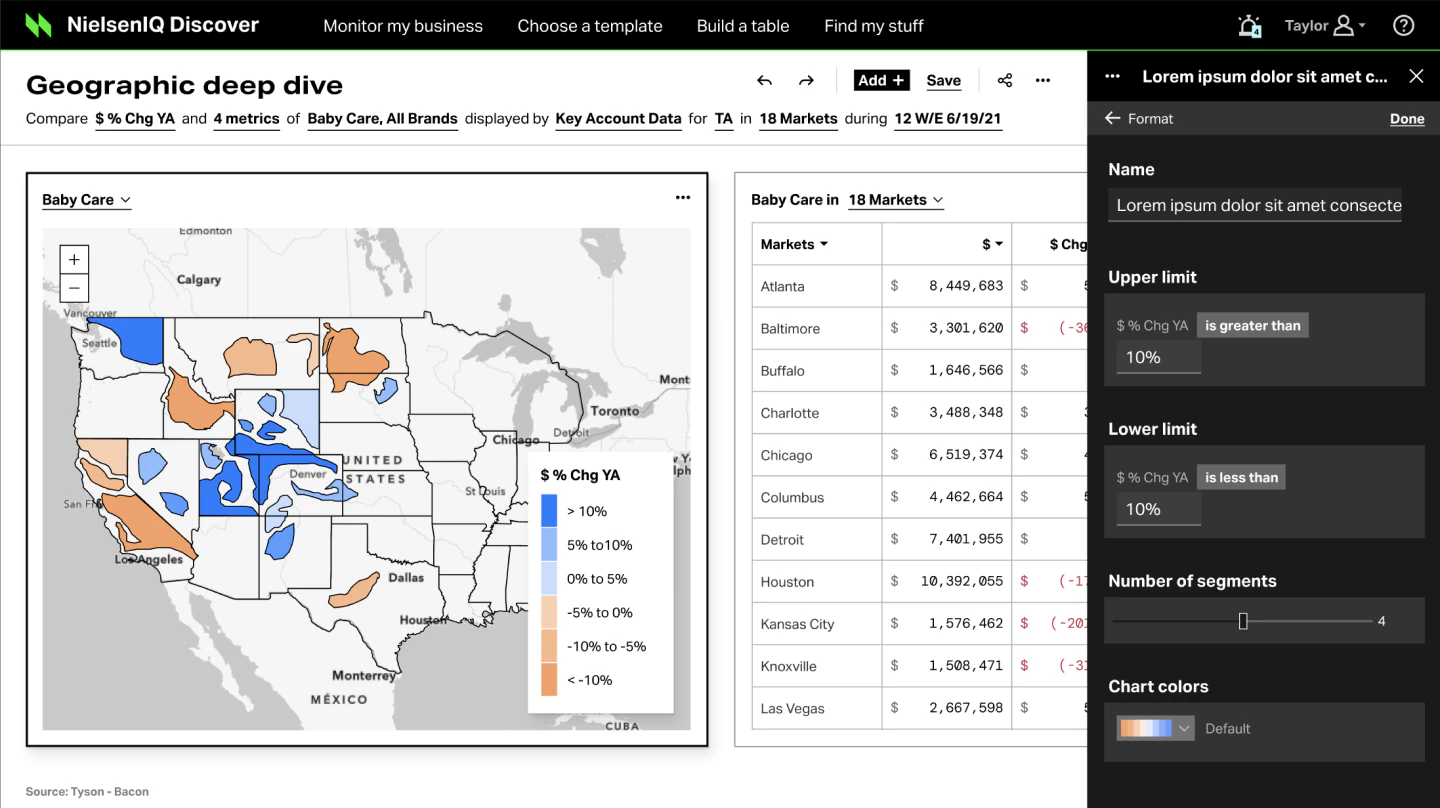
The pattern underneath the interviews was simple. Whatever their job, people cared about four things: monitoring their business, creating reports from templates, building reports from scratch, and keeping all their assets in one place. Those four became the product's structure, and its navigation: Monitor my business, Choose a template, Build a table, and Find my stuff.
Within each, I defined the key objects customers needed to get work done: what each one is, how it relates to the others, and how it relates to the system as a whole. Working from objects instead of features cut through the noise of several products' worth of functionality and left what customers needed most.
Outcome
50+
People interviewed
4
Core sections
~1 yr
To complete
0
Customers lost
The project took about a year to complete, and NielsenIQ did not lose a single customer through the design and development lifecycle.